
Manual or automatic bagging is not a question of ambition, it is arithmetic on five cost lines: labor, output, material waste, quality escapes and the machine's own cost of ownership. The framework below turns each line into a formula where every input comes from your plant, your wages, your weights, your reject rates, so the answer is yours, not a supplier's. The short version: automatic bagging pays when volume is steady and labor is expensive or scarce, manual stays right when volumes are low, variable or seasonal, and the payback formula in the middle tells you which side of that line you stand on. Every number in the worked example is illustrative and labeled as such; replace it with your own and the framework holds.
Key takeaways
Five lines decide it: direct labor, output ceiling, material waste, quality escapes, and total cost of owning the machine.
Build each line as a formula from your own plant data: heads, wages, weights, reject rates. A supplier's numbers cannot answer a question only your data can.
Labor is the biggest line in most manual bagging operations; our cost-analysis article places labor at up to 60 percent of total packaging cost in typical factories.
The machine's own cost is more than its price: installation, training and spares add 15 to 25 percent, 40 to 80 training hours and 10 to 15 percent of equipment value in annual spares.
Payback equals initial investment divided by the annual saving; anything under roughly two years is usually a strong case, anything over three deserves a volume re-check.
Manual remains correct below a volume threshold, for high-mix handmade products, and for seasonal peaks where a machine would idle.
| Cost line | Manual bagging | Automatic bagging | Your input data |
|---|---|---|---|
| 1 Direct labor | Heads per shift x loaded wage x shifts x days | 1 supervisor, sometimes shared across lines | Headcount, wages, shift pattern |
| 2 Output ceiling | Capped by human pace, overtime to chase demand | Machine cycle rate, capped by feeding and product | Units per shift, demand peaks |
| 3 Material waste | Overfill variance, film scrap on manual cuts | Tighter fill control, film scrap on changeover | Average overfill, film price |
| 4 Quality escapes | Seal and weight variation, rework, returns | Repeatable seals and weights, detectable faults | Reject rate, rework cost |
| 5 Machine ownership | Near zero | Purchase + install + training + spares + power | Quotes, utility rates |
Total each column over a year, and the difference is your annual saving. Divide the investment by the saving and you have payback. That is the whole framework; the sections below put discipline behind each line.
Count heads per shift on the bagging operation only, not the whole factory: filling, sealing, labeling, case packing as far as your scope reaches. Multiply by fully loaded annual cost per head, wage plus social charges plus the overhead of recruitment and turnover, times shifts times working days. That product is your annual manual labor line.
On the automatic side, one supervisor per shift is the typical pattern, and the staffing change is the part operators feel first. Our article on efficient packaging systems and production costs records a representative case where an operation needing 6 to 8 workers per shift ran the same workload with one person supervising the machine, and places labor at up to 60 percent of total packaging cost in typical factories. Use those as orientation, then run your own headcount: two positions saved at your loaded wage, not a benchmark's, is the number that reaches your finance department.
Manual bagging has a hard ceiling set by human pace, and the cost of that ceiling is the part plants forget: overtime to chase demand, late penalties, or sales quietly lost because the line said no. Estimate the units per shift your crew actually sustains, hour by hour including breaks and fatigue, not the best hour anyone remembers.
An automatic line's honest rate is the sustained rate at your dose weight and product, which is why trials matter more than catalog maximums. The line to compute is the value of the gap: units of unmet or overtime-covered demand times margin per unit, per year. If the gap is zero, Line 2 contributes nothing and the case rests on the other four lines, which is a perfectly common outcome for stable low-volume plants.
Manual filling over-targets to avoid underweight complaints, and every gram of average overfill is giveaway multiplied by annual units. Weigh a sample of finished packs, compute the average overfill, and multiply by annual unit count and cost per kilogram: the result routinely surprises plants that have never measured it. Add film scrap from manual cutting and mis-formed bags.
Automatic weighing and filling tightens the spread around target, and the same measurement discipline applies: the saving is old average overfill minus new, times volume. Our cost-analysis article cites material waste reductions in the 15 to 30 percent range from controlled, precise systems, treat that as orientation and let your own sample weights carry the argument. One caution: if your manual overfill has never been measured, measure it before any supplier meeting, because it is both a cost line and a negotiating fact.
Every weak seal, weight outlier and mislabeled pack that leaves the plant carries a cost: rework, credit, returns logistics, and in the worst case a lost customer. Count them honestly from your complaints and rework logs, assign a cost per event, and extend to a year. Manual operations show wider variation by nature; automatic lines narrow the spread and, with checkweighers or seal inspection in scope, move faults from customer complaints to line rejects you catch yourself.
The honest accounting also credits risk: a single lost retail customer from a quality escape can outweigh a year of labor savings, which is why this line belongs in the framework even when its annual number looks small.
The purchase price is the start, not the line. Our transition guide to automated packaging puts the adders with unusual clarity: installation and integration typically 15 to 25 percent of equipment cost, operator training 40 to 80 hours per shift, and a spares inventory recommended at 10 to 15 percent of equipment value annually. Add power and compressed air, consumable jaws and belts, and the service contract.
Amortize the total over your expected machine life and add the annual running costs; that is the automatic column of Line 5. The same guide reports that 30 to 50 percent of automation projects miss their ROI targets through under-planned integration, which is the strongest argument for running this framework before, not after, the purchase order.
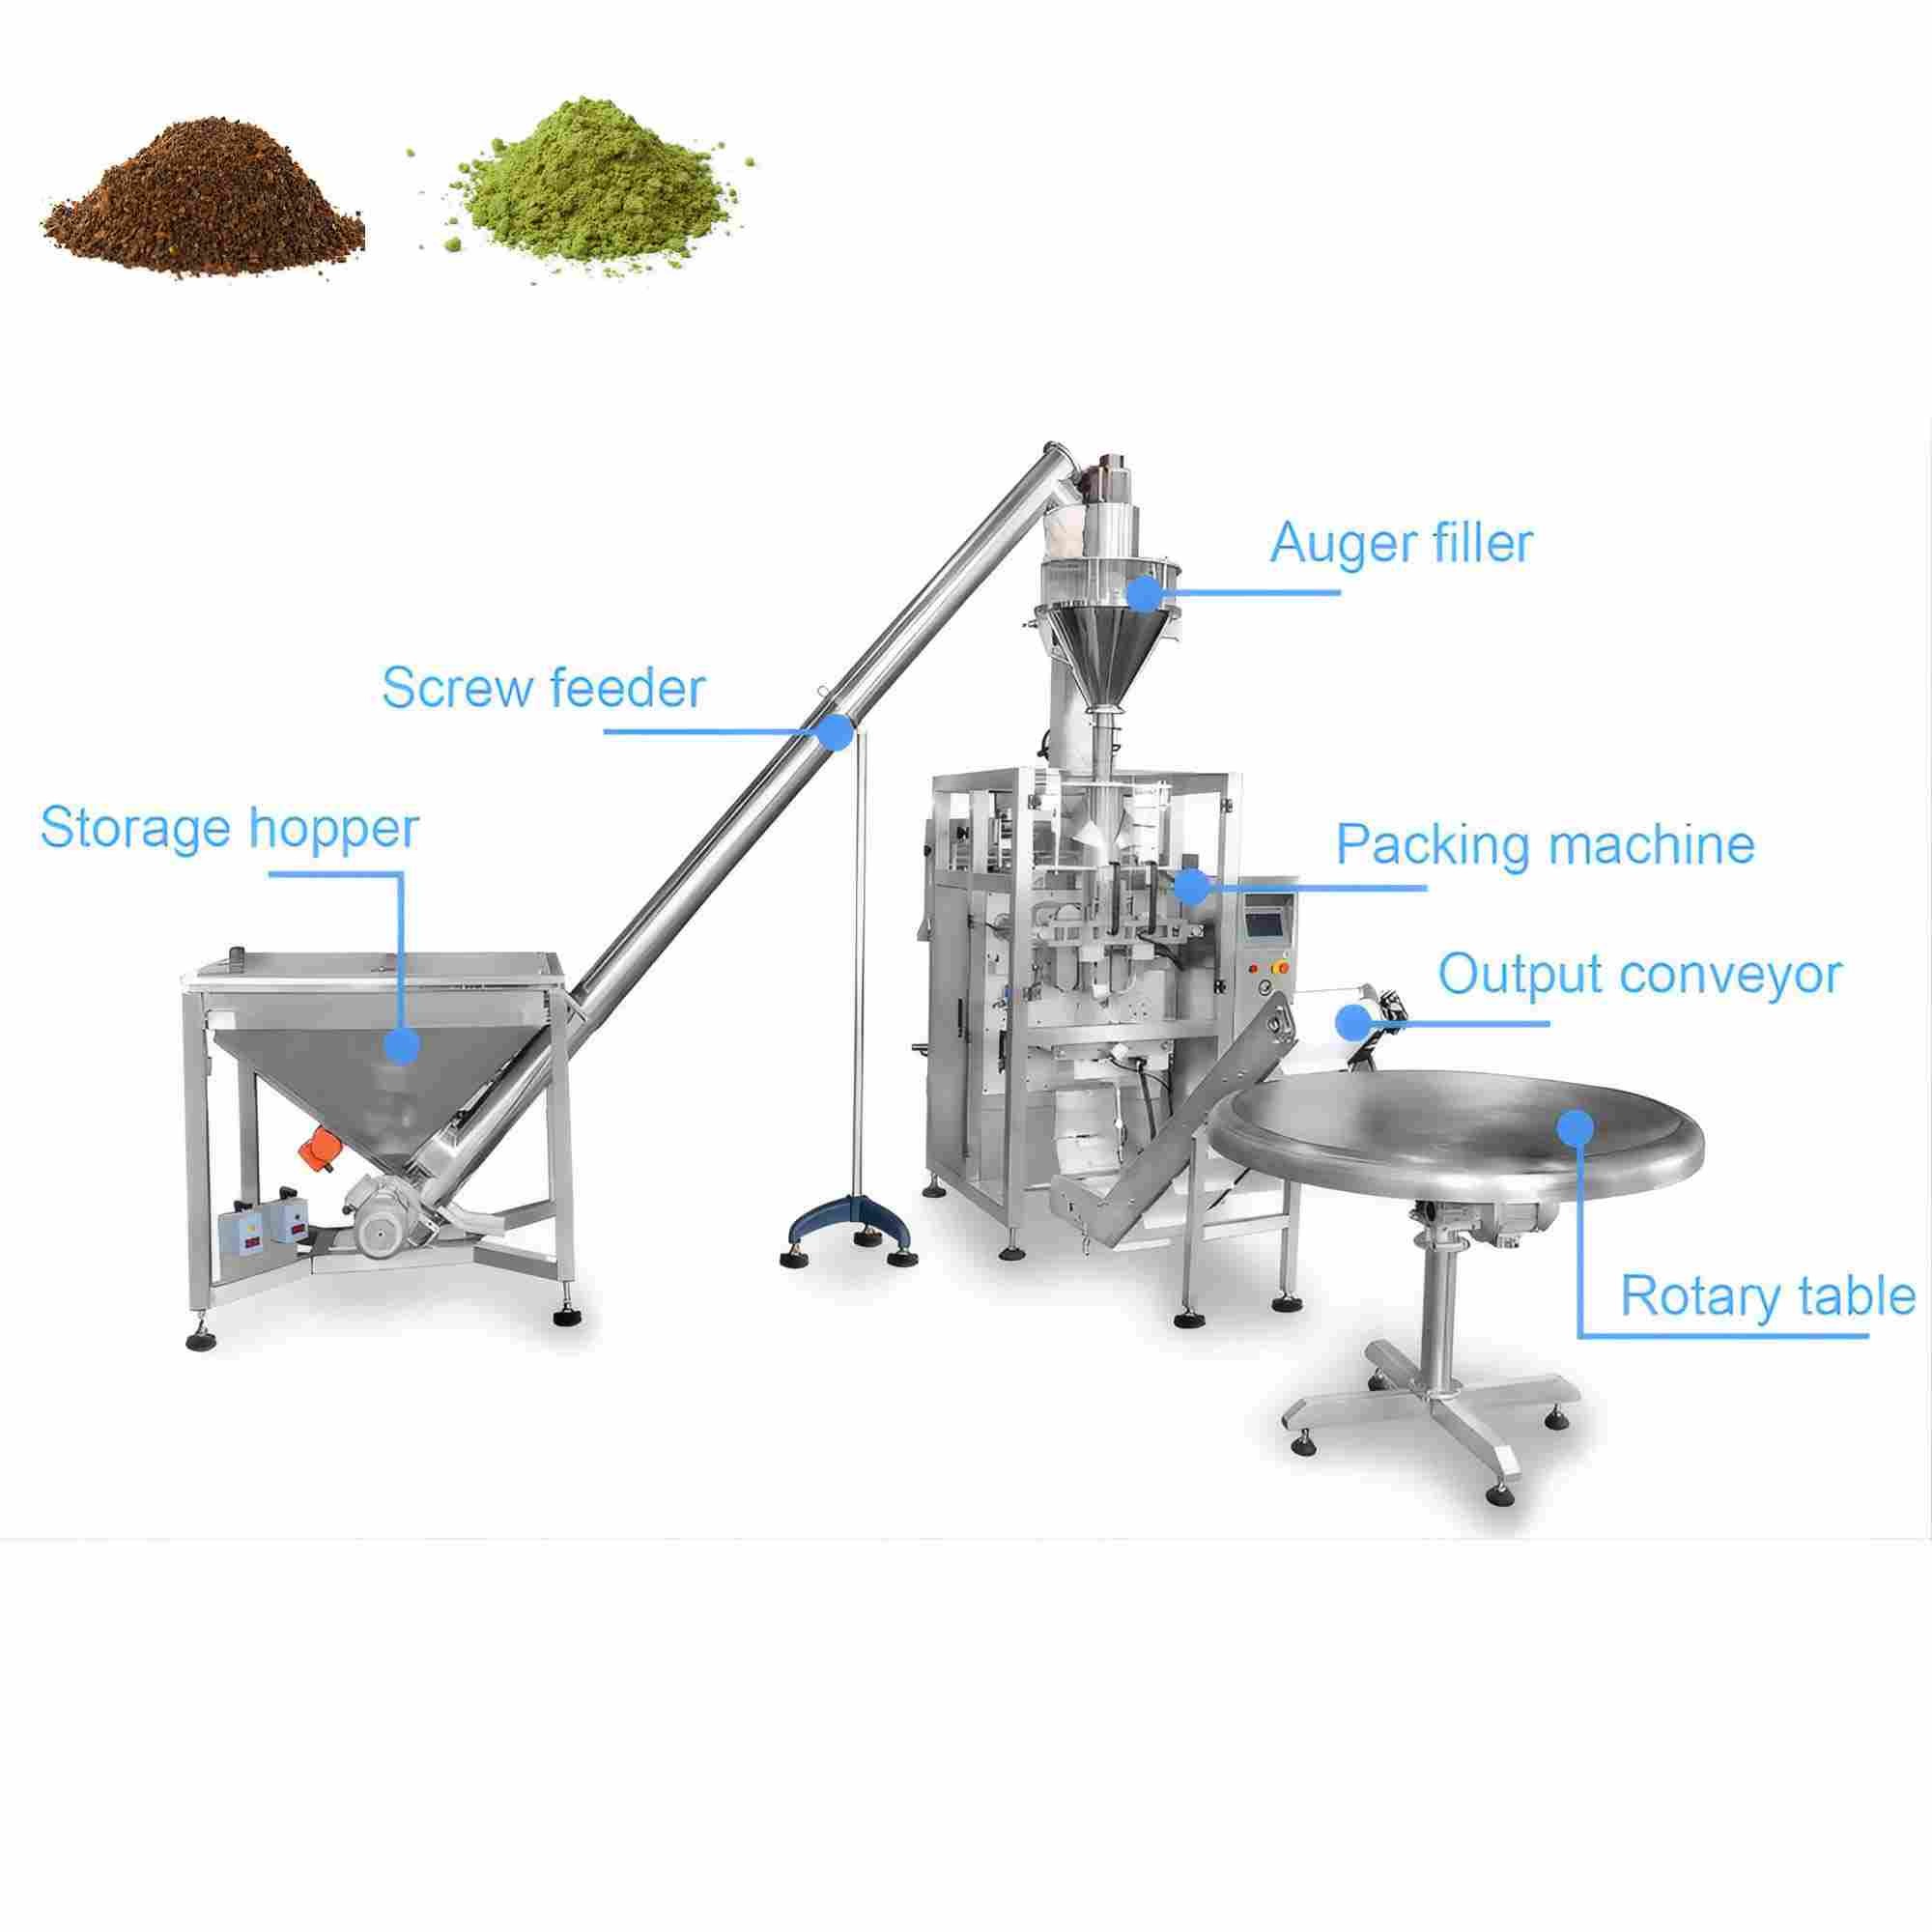
Payback in years equals total initial investment divided by annual saving, where annual saving is the sum of Lines 1 through 4 manual minus automatic. A labeled illustration, using figures you should replace: suppose manual bagging runs 6 heads across 2 shifts at a loaded 25,000 per head per year, Line 1 is 300,000. Say the automatic line needs 1 head per shift at the same wage, Line 1 automatic is 50,000. Suppose measured giveaway and waste fall by 20,000 a year and quality escapes by 10,000, while output needs no overtime either way, Line 2 zero. Annual saving is 230,000. If the configured line, including installation, training and first-year spares, costs 280,000, payback is about 1.2 years.
Now stress it the way reality will: halve the volume and the labor saving halves; add a second product family and changeover enters the sum; lose a shift and Line 1 collapses. The framework's value is exactly this, that each assumption is visible and negotiable, and a ten-minute re-run with better numbers beats a slide deck with benchmark figures.
| Situation | Why manual holds |
|---|---|
| Volume below the machine's efficient range | The line idles, payback stretches past any defensible horizon |
| Highly variable or seasonal demand | A machine sized for peak is idle in the trough; peak-only labor flexes |
| Handmade or artisan positioning | Machine uniformity contradicts the product's promise |
| Product roadmap unstable | The right machine spec is unknowable until SKUs settle |
| Labor cheap, available and stable | The labor saving shrinks, and the other lines rarely carry the case alone |
None of these is a failure to modernize; they are the framework's other output. The same arithmetic that justifies a machine at one volume justifies patience at half of it.
When the framework clears your internal hurdle, execution quality decides whether the projected savings arrive. The transition guide's sequence is worth following closely: audit and time-study the manual process first, define target KPIs second, then select equipment against measured data. Two practical companions from our case pages: the account of reducing labor dependence in snack packaging shows the staffing change on a real line, and the case study index collects configuration examples by product family. Budget the process redesign and operator training as line items, because the machine is the easy part of the project.
Divide the total initial investment, machine plus installation, training and starting spares, by the annual saving from the five lines: labor reduced, overtime avoided, waste cut, quality escapes prevented, minus the machine's annual running cost. The five-line framework above exists so that each input is a number from your plant rather than a benchmark.
There is no universal threshold, because wages, product value and shift patterns move it. A plant with high wages and two steady shifts justifies a machine at a volume where a low-wage single-shift plant does not. Run the framework with your numbers; if payback lands between two and three years, volume is the assumption to stress hardest.
It reduces the labor line whenever volume keeps the machine busy, but a machine sized for a peak you reach twice a year saves less than it costs. The case accounts we publish show supervisor-level staffing on running lines, and the same arithmetic can show a smaller line paying for itself with one shared operator.
Installation and integration at 15 to 25 percent of equipment price, operator training at 40 to 80 hours per shift, a spares inventory at 10 to 15 percent of equipment value per year, plus power, compressed air and consumables. These adders are documented in our transition guide and belong in Line 5 of the framework before purchase, not after.
Yes, and it is often the right order: automate the bottleneck station first, usually weighing and filling, and keep manual case packing until volumes justify the next step. Stage the roadmap with the same five-line framework at each step, so each purchase stands on its own payback rather than on a promise of future volume.
Not sure which bagging setup fits your product and output target? Send us your product details, bag format and target speed, and get a machine recommendation and quote.
Contact: LTC Bagging System
Phone: +8613337332946
E-mail: [email protected]
Add: Wenzhou, Zhejiang Province, China